 BoxCart
Reports Pro
The Reports screen gives you an at-a-glance view of how your store is performing, with summary stats, an orders-and-revenue chart, and breakdown tables. Reports are part of BoxCart Pro.
Sales Reports are available with an active BoxCart Pro licence. On the free build the Reports menu item is not shown.
Overview
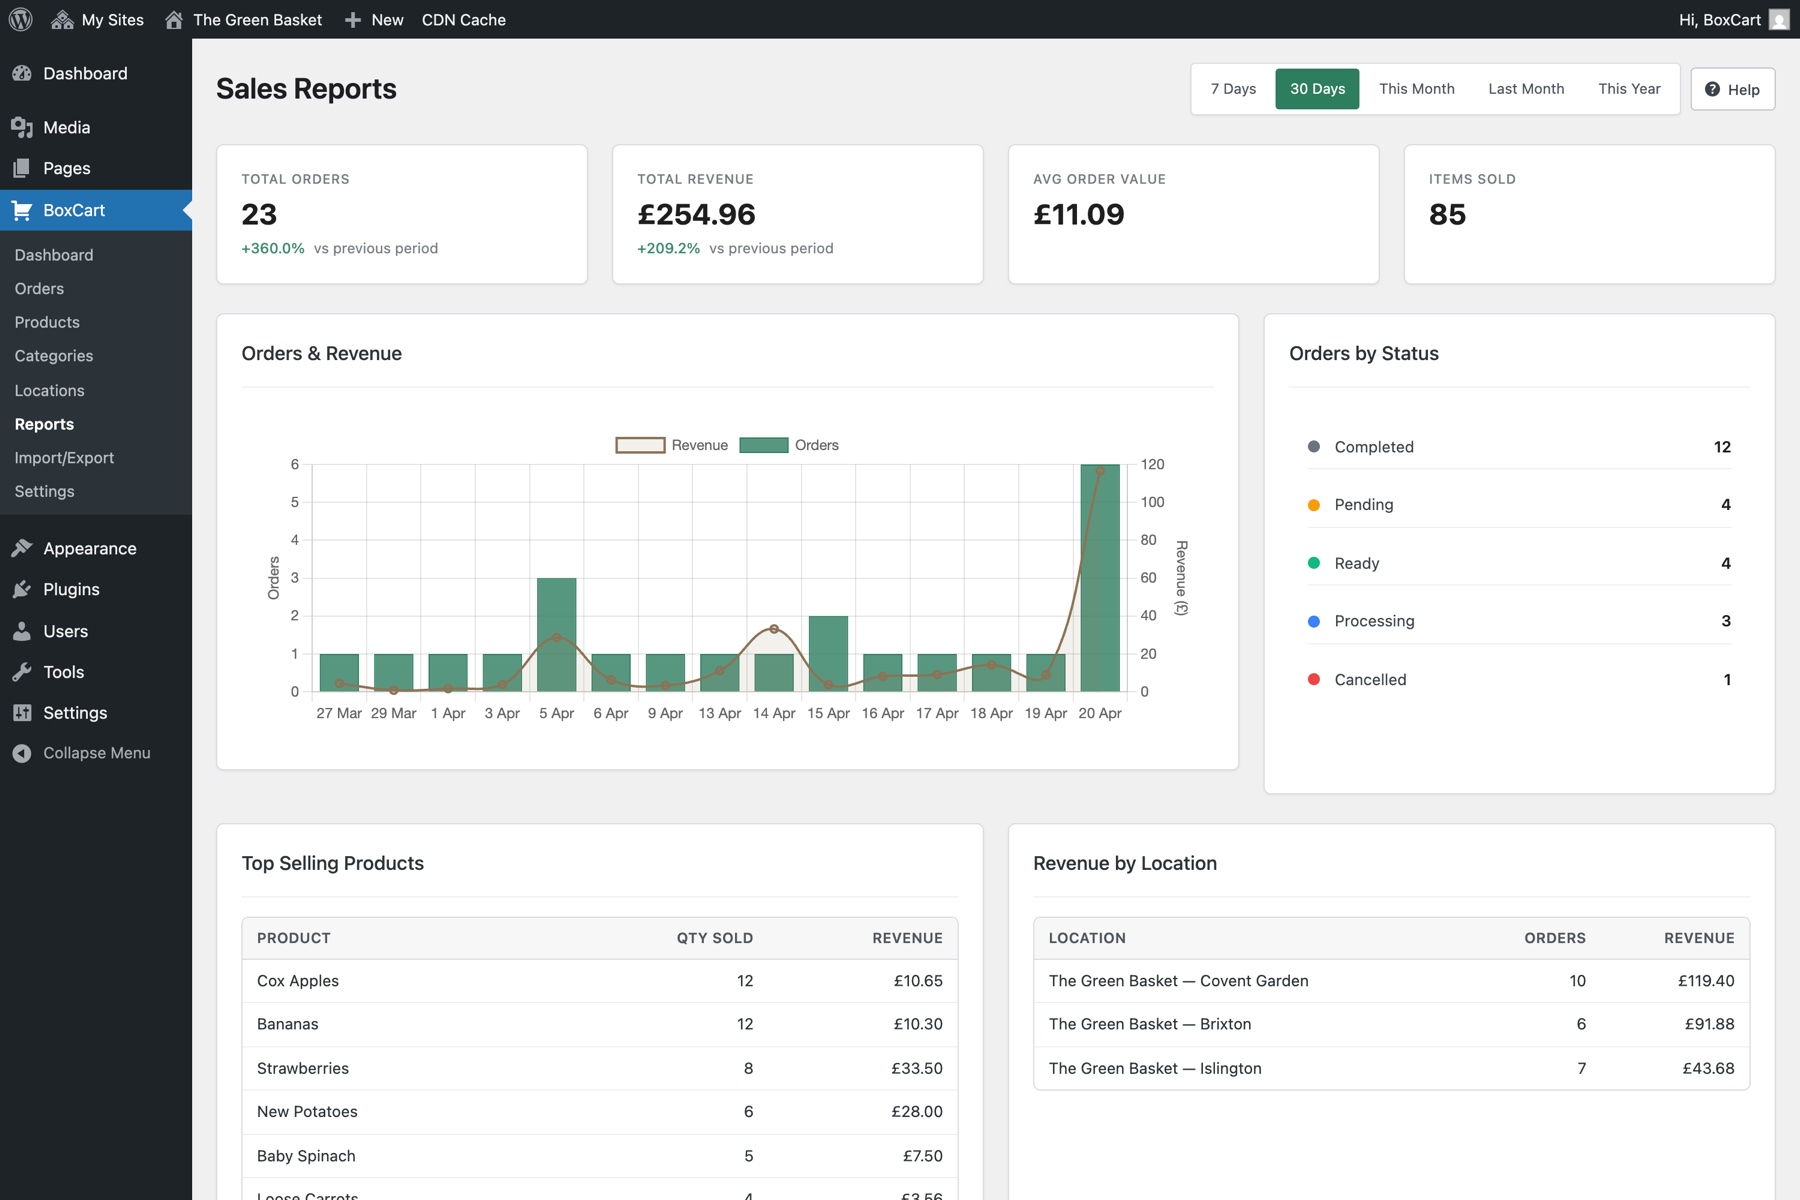
Open BoxCart → Reports to see your sales performance for a chosen period. Use the period selector at the top to switch between Last 7 days, Last 30 days, This month, Last month, and This year. Each figure is compared against the equivalent previous period so you can see whether a number is up or down.
Summary stats
Four headline cards summarise the selected period:
| Stat | What it shows |
|---|---|
| Total Orders | The number of orders placed in the period (cancelled orders are excluded). |
| Total Revenue | The combined value of those orders in your store currency. |
| Average Order Value | Total revenue divided by the number of orders. |
| Items Sold | The total quantity of items across all orders in the period. |
Each card also shows the percentage change against the previous period (for example, this 30 days compared with the previous 30 days).
Orders and revenue chart
Below the summary cards, an interactive line chart plots orders and revenue over time for the selected period, so you can spot busy days, weekly patterns, and the effect of promotions.
Breakdown tables
- Orders by Status - how many orders are currently Pending, Processing, Ready, Completed, or Cancelled.
- Top Selling Products - your best sellers by quantity for the period, useful for planning stock and promotions.
- Revenue by Location - which pickup locations are busiest, so you can see where demand is concentrated.
Reports read from your existing orders, so there is nothing to configure. Just place some test orders, then open BoxCart → Reports to see them reflected.